Popular technician Charting Guy (@ChartingGuy) calls Shiba Inu “weak and choppy” and suggests the token may not break out until late in the current crypto 0 a weekly Shiba Inu chart, he wrote on Oct. 26, 2025: “SHIB has been weak and choppy all cycle. Won’t do anything until the end imo.” How High Can Shiba Inu Price Go? The below TradingView chart is a weekly SHIB/USD study anchored to a Fibonacci 1 price marker on the right rail reads $0.000010205, placing SHIB fractionally below the 0.236 retracement band annotated at $0.000011043. Above that, the chart maps successive overhead levels at 0.382 near $0.000016434, 0.5 around $0.000022661, 0.618 near $0.000031247 and 0.786 at about $0.000049369.
The red 1 line flags $0.000088410, with higher extension markers plotted at 1.272 ≈ $0.000185406, 1.414 ≈ $0.000272917 and a terminal 1.618 ≈ $0.000475605. A stylized projection trace on the chart depicts a late-cycle, near-vertical advance that only materializes after a prolonged base and then stalls inside the 1.0–1.272 cluster before breaking above the 1.272 Fib extension and topping below the 1.414 Fib extension roughly at $0.000022; the path visually reinforces the author’s contention that SHIB underperforms until the “end.” Related Reading: Shiba Inu Holds Firm Despite 18% Crash, 1.5M Holders Signal Faith in 2025 Recovery In a separate post on Oct. 24, Charting Guy ranked market structures across majors and large-cap altcoins, explicitly placing SHIB in his “Bad Looking Charts” bucket while labeling Bitcoin, Ether, XRP, Solana, BNB and Stellar as “Good Looking Charts.” His list read, in part: “Good Looking Charts: BTC, ETH, XRP, SOL, BNB, XLM … Decent Looking Charts: XDC, DOGE, PENGU, ADA, ONDO, SUI, AAVE, LTC … Eh Looking Charts: PEPE, FLOKI, FLR, LINK, BCH … Bad Looking Charts: SHIB, WIF, ETC, AVAX, FET, RENDER, INJ, CRV, ALGO, SOLO, COREUM, NEAR, VET, COMP, DOT, IOTA, FIL, ATOM, And many more.” What To Expect The technical message is unambiguous: on a weekly timeframe, SHIB remains capped beneath early Fibonacci thresholds that many chartists treat as momentum 2 below 0.236 typically signals that price has yet to reclaim even the shallowest retracement of the prior cycle; clearing it often opens room to test the 0.382–0.5 midpoint zone where trends either accelerate or 3 Reading: Here’s Why The Shiba Inu Price Could Bottom And Rise Another 40% In Charting Guy’s map, structurally meaningful inflection areas stack tightly from roughly $0.000016 to $0.000031, with the 0.618 level near $0.000031 attributed the role of a trend-confirmation 4 cycle-top roadmap he drew concentrates risk and reward into the higher cluster around $0.000088 to $0.000185, a range often watched by Fibonacci practitioners for exhaustion and distribution in late-stage moves.
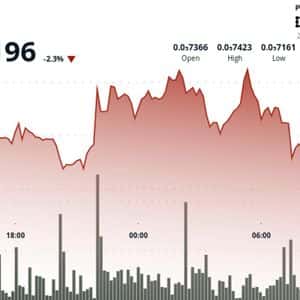
However, a rise to $0.00022 could still mean an incredible upside for SHIB of around 2,055.81%—a roughly 20.56-fold increase. Contextually, his relative-strength table is just as important as the 5 grouping SHIB with other “bad looking” structures while upgrading Bitcoin, Ether, XRP, Solana and BNB, he is signaling an expectation that market breadth will remain narrow and quality-led before any speculative rotation into meme-beta like 6 framework aligns with his succinct call that SHIB “won’t do anything until the end,” implying a sequencing view rather than a categorical 7 press time, SHIB traded at $0.00001046. Featured image created with DALL.
E, chart from 8
Story Tags

Latest news and analysis from NewsBTC