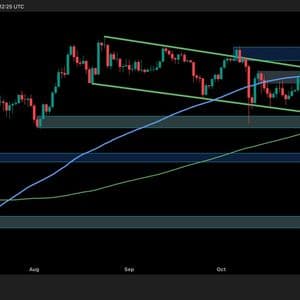
Ethereum is showing signs of strength again as it attempts to reclaim key resistance levels after a sharp early-October 0 bounce from the lower boundary of the descending channel has brought it back toward $4,150. Momentum is building, but the market remains cautious ahead of key resistance 1 Analysis By Shayan The Daily Chart On the daily chart, the asset is retesting a supply zone just under the top of the descending 2 rejection wicks from last week showed clear seller interest, but today’s candle is pushing back into that region, suggesting a potential breakout 3 100-day moving average, located around $4,150 mark, is acting as resistance for now, while the 200-day moving average sits much lower, around the $3,300 4 ETH manages to close above $4,200 and the higher boundary of the pattern, the next test will likely be around $4,600.
Yet, buyers still need stronger 5 4-Hour Chart On the 4-hour chart, ETH pierced into the orange supply zone at $4,200, but is facing a quick 6 zone is just below the top of the descending channel, adding more 7 RSI also printed an overbought signal and has turned down from these elevated levels, indicating a potential short-term pullback or consolidation. However, higher lows are still forming, and the recent rally from $3,600 has been sharp, showing aggressive buyers stepping in on 8 Analysis Funding Rates Sentiment across the Ethereum futures market is showing signs of growing optimism, but it has not yet reached a dangerous 9 rates have turned consistently positive after some significant negative prints, especially during the September and early October 10 suggests that more traders are positioning long, expecting further upside.
However, funding isn’t excessively high, meaning the market hasn’t yet entered a euphoric or over-leveraged phase. That’s a healthy sign for continuation, especially if the price manages to break above the current resistance range.
Story Tags

Latest news and analysis from Crypto Potato