Bitcoin is attempting a recovery after last week’s sharp correction, but the market remains at a major decision 0 the price has bounced, the broader sentiment remains 1 key question is whether this bounce is a real reversal or just a temporary relief before another leg 2 Analysis By Shayan The Daily Chart On the daily chart, BTC found support and bounced off the 200-day moving average around $108K. This area has held as strong demand in previous corrections, and used to act as a base for the latest bullish move in September and early October. However, the asset still hasn’t broken back above the dotted midline of the channel or the 100-day MA, both located around the $115K 3 we see a daily close above these two resistance elements, the buyers cannot regain full 4 4-Hour Chart On the 4H timeframe, BTC is testing the descending trendline from the recent high and is currently hovering around the $111K 5 structure is showing a potential breakout, but the price needs to close above the $112K area to confirm a shift in short-term 6 RSI is also pushing toward 60, suggesting growing bullish pressure but not yet 7 case the descending trendline breaks to the upside, the price will likely target the $116K resistance zone in the upcoming 8 the other hand, a failed breakout would probably lead to a deeper decline toward the critical $100K demand 9 Analysis Open Interest Analyzing the futures market sentiment, open interest is forming a base around 35 billion after a sharp flush, indicating that while some traders are stepping back into leveraged positions, the overall market sentiment is still 10 the open interest still relatively high compared to recent historical levels, the risk of another cascade liquidation remains, especially if the market breaks below the mentioned resistance 11 BTC fails to reclaim $115K cleanly, another wave of long liquidations could follow, especially heading into the weekend.
Story Tags

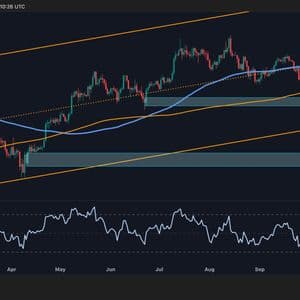
Latest news and analysis from Crypto Potato