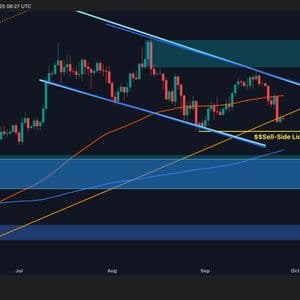
Bitcoin has broken below the 100-day moving average at $113.4K, signaling growing bearish sentiment after the recent 0 price is now consolidating in a critical zone where demand levels will dictate the next directional 1 Analysis By Shayan The Daily Chart On the daily timeframe, Bitcoin has dropped beneath the 100-day MA, leaving the price caught between the 100-day ($113K) and 200-day ($104K) moving 2 range often acts as a “no man’s land,” reflecting indecision until either buyers or sellers reclaim 3 descending channel structure remains intact, suggesting persistent downward pressure unless bulls can defend the channel’s lower boundary near $109K.
Holding above this region is essential to prevent deeper tests toward the 200-day MA and the $100K–$102K demand zone. Notably, there is a visible sell-side liquidity pocket below $107K, which could draw the price lower in a liquidity sweep before any major reversal attempt 4 4-Hour Chart On the 4-hour timeframe, Bitcoin was rejected aggressively from $117K, triggering a cascade of 5 decline has brought the price into a bullish flag structure, with BTC now hovering just above a key demand zone below $110K. This area is vital for preserving bullish 6 buyers defend it successfully, Bitcoin could stage a rebound toward recent highs. However, a breakdown here would likely accelerate the move toward the deeper liquidity pool near $100K, aligning with the 200-day 7 next leg will depend on whether demand can withstand continued sell pressure or if sellers push the market into fresh 8 Analysis By Shayan The Binance BTC/USDT liquidation heatmap (2-week view) reveals how recent volatility has been liquidity-driven.
A substantial cluster of liquidations has formed above the $117K swing high, where aggressive selling forced longs into 9 band highlights the heavy concentration of stop-losses and overleveraged longs that amplified the 10 contrast, the heatmap shows no major liquidity clusters below the current price, implying that sellers may have already exhausted near-term downside 11 Bitcoin stabilizing around $109K, this absence of downside targets may temporarily limit further declines, unless fresh order flow builds 12 now, the market remains defined by this imbalance: the $117K liquidity band overhead acts as a cap where supply dominates, while the $109K demand base must hold to avoid a deeper slide toward the $100K zone.
Story Tags

Latest news and analysis from Crypto Potato


