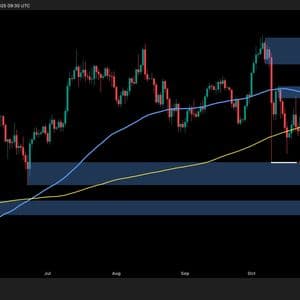
Bitcoin has recently fallen below the crucial $100K support level, indicating a notable bearish 0 buyers couldn’t hold this critical level, another cascade toward the $95K range will 1 Analysis By Shayan The Daily Chart On the daily timeframe, BTC remains locked between the $100K–$102K demand block and the $114K resistance cluster, with both the 100-day and 200-day moving averages now acting as overhead 2 most recent rejection from the 100-day MA around $110K led to a retest of the $101K support, completing a full liquidity sweep of the previous range 3 stands out now is the price stabilization within a historical high-volume node, exactly where previous macro corrections have found their 4 extended series of equal lows (marked “$$”) suggests that liquidity below $100K has likely been harvested, a condition that, if followed by consolidation and a higher low formation, could confirm the presence of strong hands absorbing 5 bulls, the first confirmation of regained strength would be a reclaim of $106K–$108K, while for bears, a clean daily close below $99K opens the door to the $93K–$95K macro accumulation 6 4-Hour Chart Zooming in, the 4-hour structure displays a compressed descending range, where every lower high is forming closer to support, a classic pattern of momentum 7 asset has repeatedly tested the $101K–$102K zone, creating short-term imbalance pockets above $106K and $110K, which may later act as magnet levels for any corrective 8 coiling behavior often appears near the end of a corrective phase, as leveraged positions are flushed out and volatility 9 the price manages to reclaim the $106K pivot, a short-term reversal toward $110K could follow, completing the mean-reversion move.
However, sustained rejection from $104K would keep the accumulation scenario open for a longer period, extending the sideways range through mid-November. On-Chain Analysis By Shayan The Realized Price by UTXO Age Bands provides critical insight into the current supply–demand balance between market cohorts. Bitcoin’s price has declined below the 1–3 month and 3–6 month holders (purple and blue lines), meaning these cohorts are collectively 10 shift transforms their realized price levels (roughly $107K–$110K) into overhead supply zones, regions where many of these short-term holders may exit at breakeven once the asset rebounds, creating initial resistance during recovery phases.
Conversely, the 6–12-month cohort’s realized price (yellow line, near $95K–$96K) is emerging as a potential demand 11 group, generally more patient mid-term holders, historically provides market support during late-stage corrections, absorbing supply from capitulating short-term 12 distribution of realized prices paints a clear structural picture; Bitcoin is trapped between realized supply (short-term loss holders) and realized demand (mid-term strong hands). A sustained defense above the 6–12 month realized price band would signal that longer-term capital continues to absorb fear-driven selling, maintaining the larger bullish cycle intact.
However, a decisive breakdown below that level would indicate a deeper capitulation event, likely resetting sentiment before any macro reversal.
Story Tags

Latest news and analysis from Crypto Potato