Bitcoin continues to struggle after the massive liquidation event earlier this 0 market’s optimism has cooled, and BTC is consolidating near $111,000 as traders remain 1 Analysis By Shayan The Daily Chart On the daily chart, BTC is hovering just above key support around $110,000, which is the critical 200-day moving average, while the 200-day moving average is acting as a resistance above the price around $116,000. The $110,000 area remains critical, and a decisive breakdown could send the market toward $101,000 and the lower boundary of the large descending channel. Meanwhile, the RSI around 42 signals neutral momentum, reflecting hesitation among both bulls and 2 Bitcoin reclaims $116,000 with strong volume, the broader uptrend remains at risk of losing its mid-term 3 4-Hour Chart The 4-hour chart highlights a tight consolidation between $110,000 and $116,000 after the strong downward 4 $110,000 range continues to hold as a demand zone, but repeated tests have weakened its 5 sits at $116,000, as already mentioned, which capped every recovery attempt over the past few 6 RSI also remains flat near 40, indicating equilibrium on the 4-hour timeframe, but the lack of momentum suggests the market could break down if sellers regain 7 Analysis Futures Open Interest Open interest across exchanges has sharply declined following the recent selloff, reflecting a clear reduction in speculative 8 are avoiding aggressive positions after getting liquidated during the last move 9 decline in leverage shows that the market is resetting, but it also signals a lack of conviction for any strong bullish continuation in the short 10 sentiment remains fragile, as fear is outweighing greed, and most participants are waiting for a stronger confirmation before re-entering long positions.
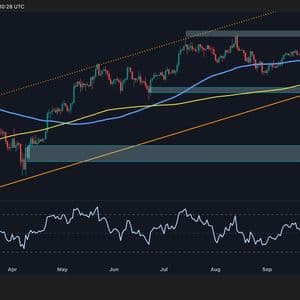
Story Tags

Latest news and analysis from Crypto Potato